

-

Ternary data vs ternary chart
Do the insights gained from ternary data organization require a ternary chart?
-

Raw Data Provenance
In my never-ending search for good way to view data distributions, one task is to take apart box plots seen in the wild and compare them with different visualizations.
-

Ceiling height vs. exam score
I’ve spent way too much time trying to understand this now-retracted study, but find a couple interesting results in the data not related to ceiling heights.
-
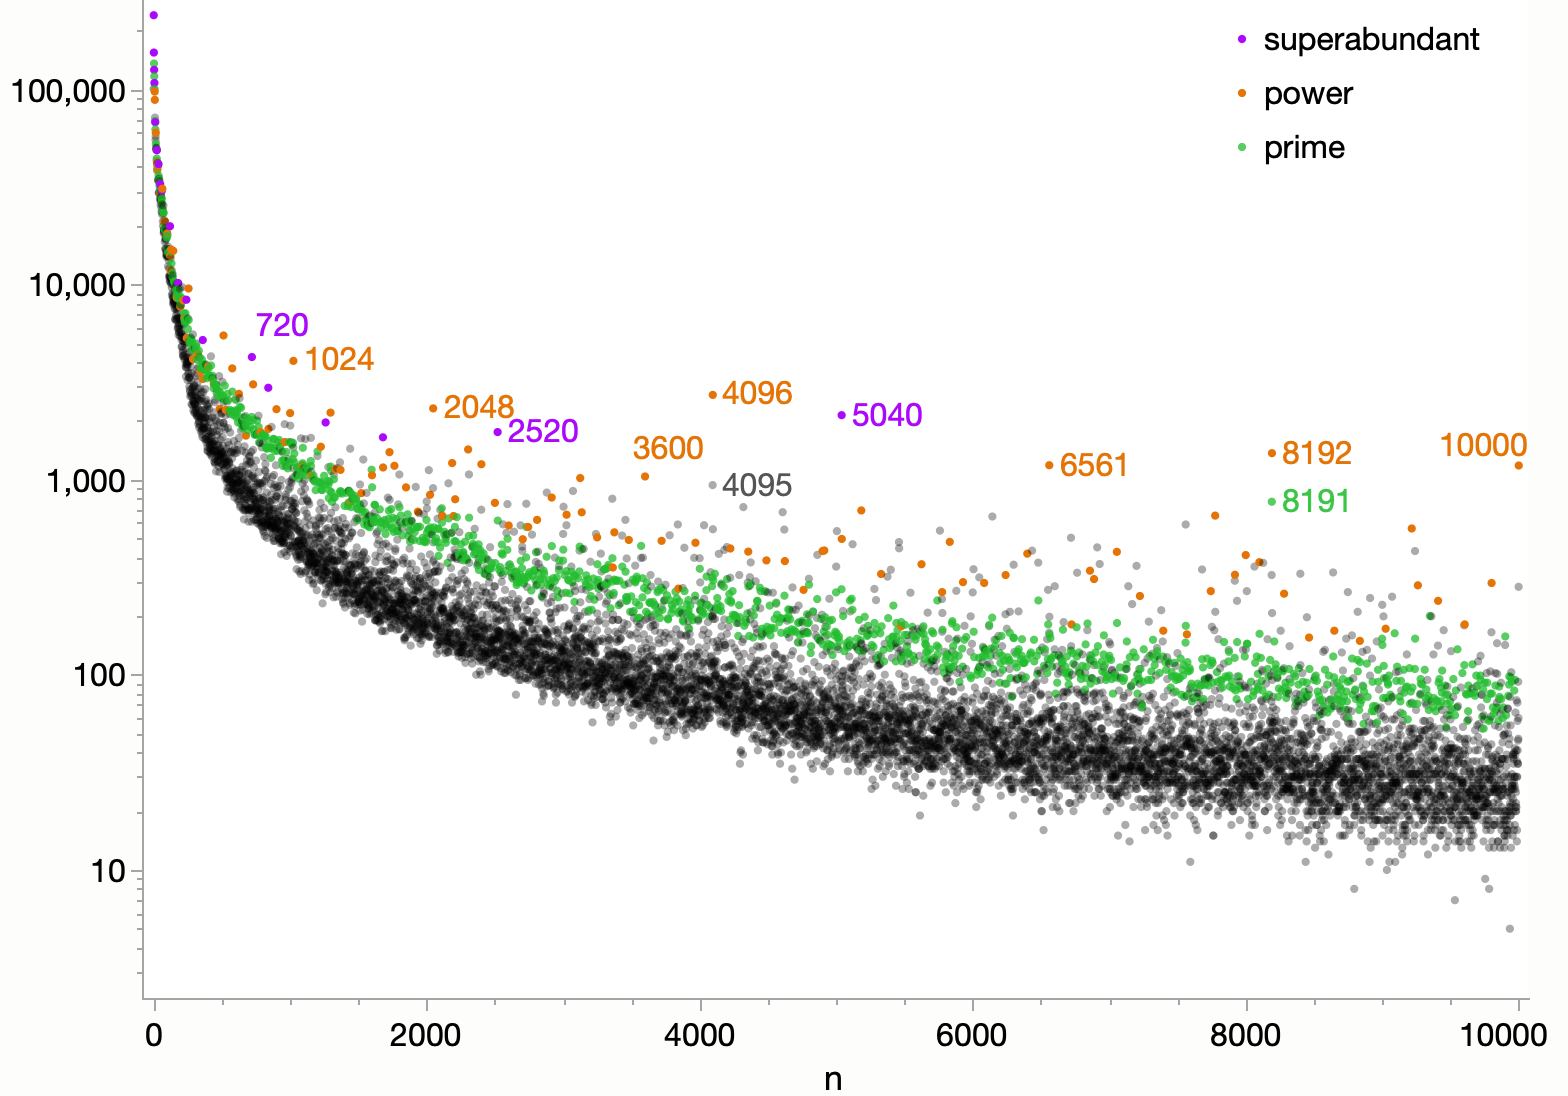
Sloane’s Gap
Taking a refreshed look at Sloane’s Gap, including a flattened version for better comparing outliers.
-
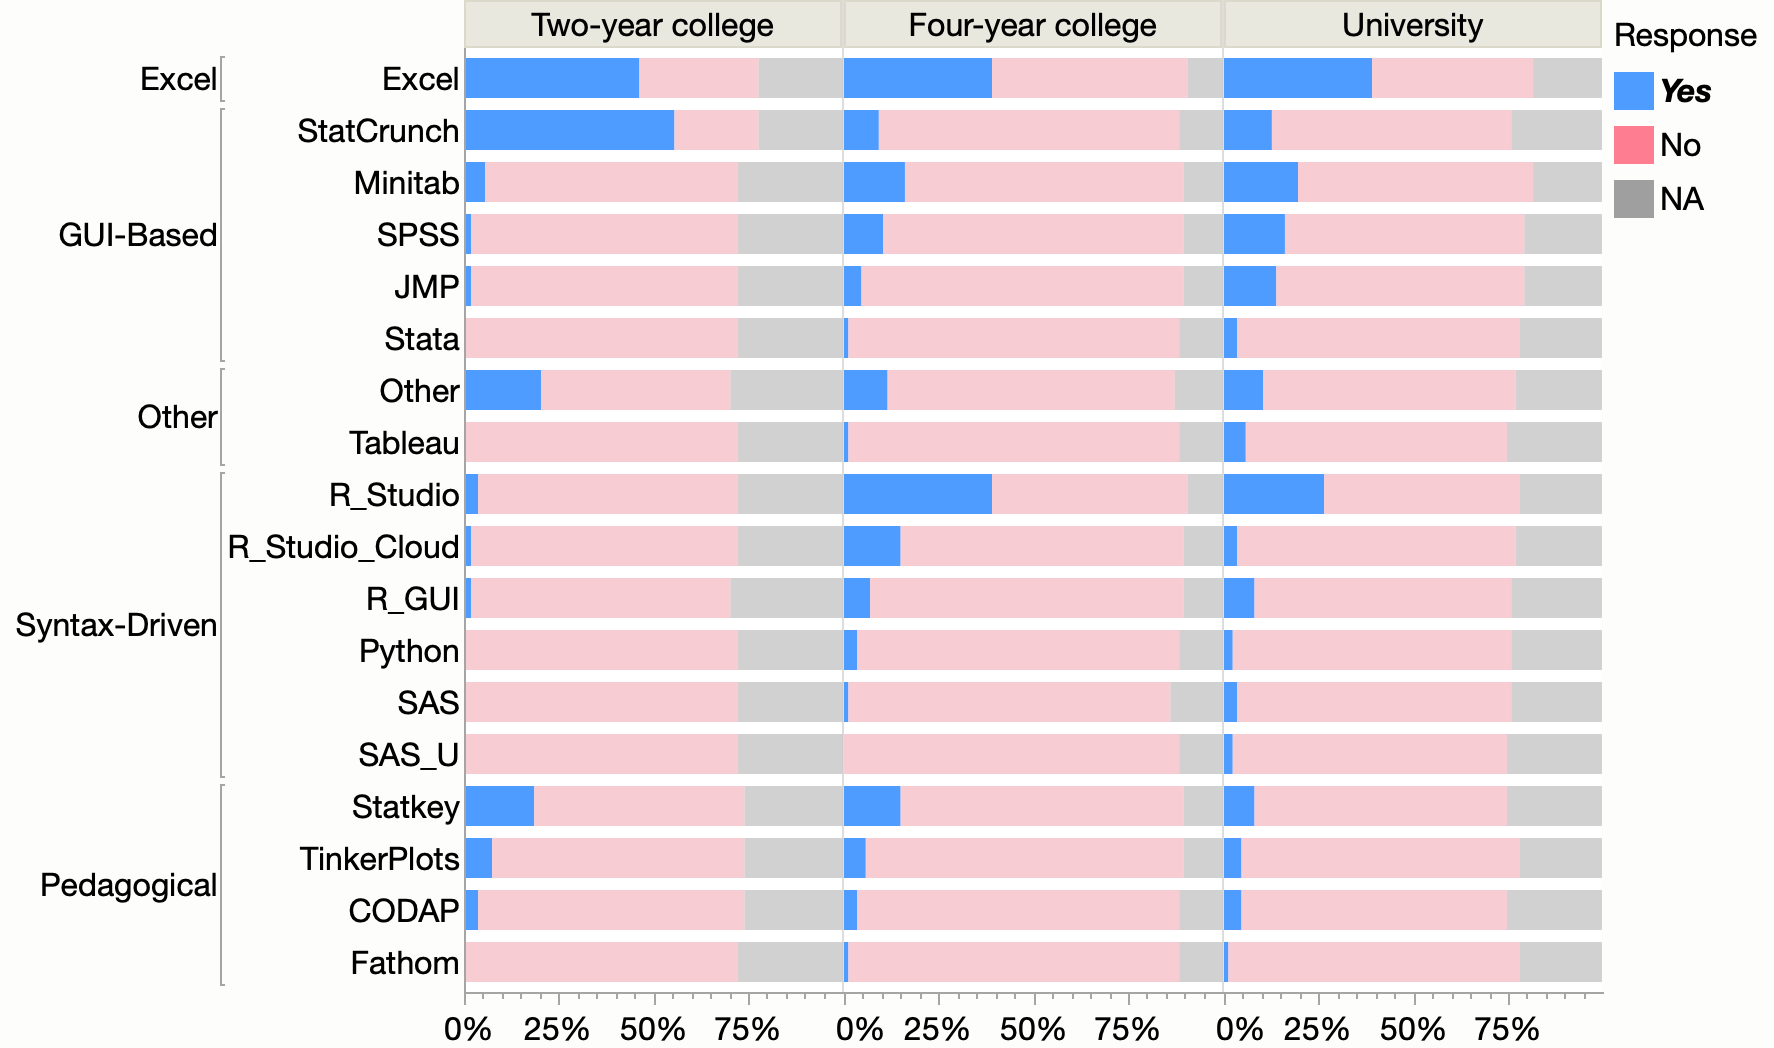
Statistical education software tool usage
I think I found a significant error in one of the figures of a journal paper about statistical teaching software usage. What next?
-

-
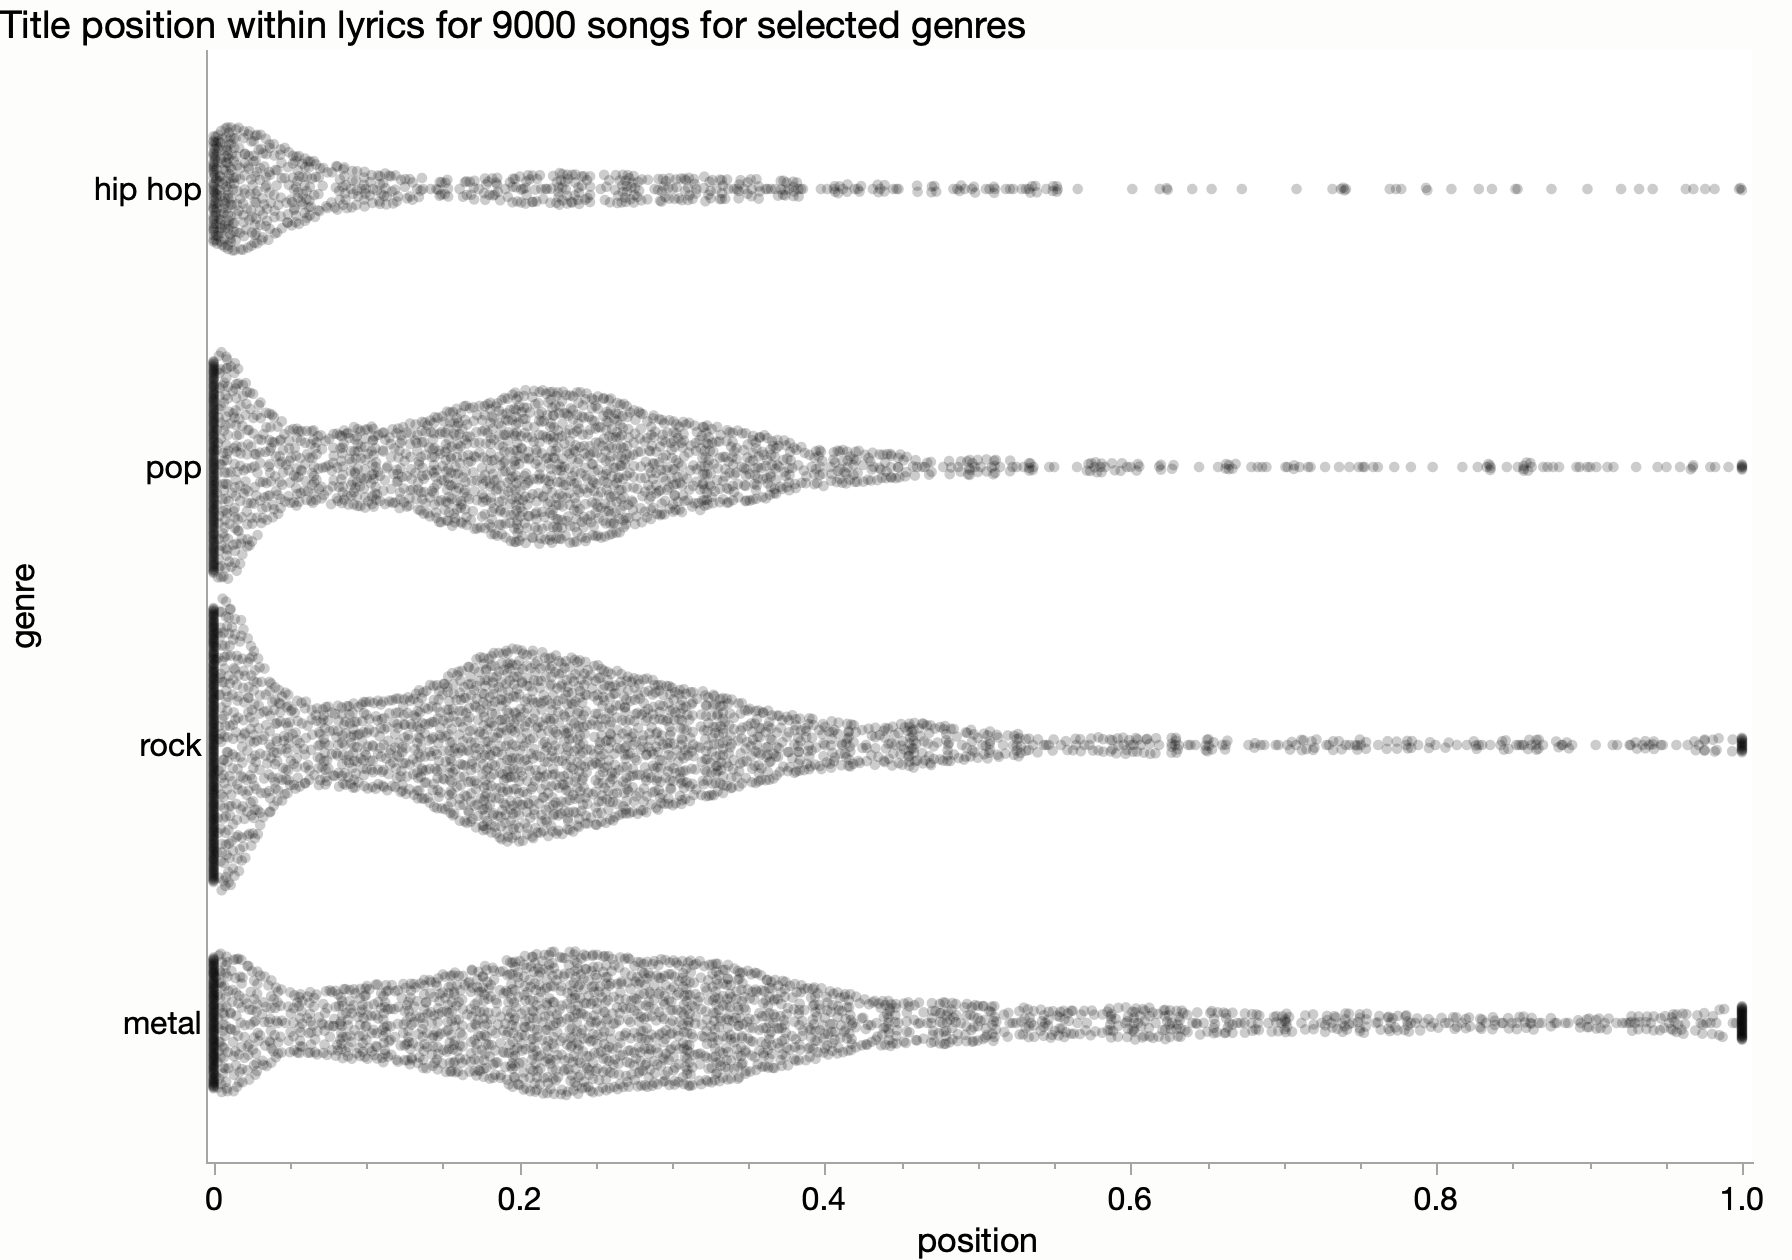
Song titles appearing in lyrics
Where does a song’s title appear within its lyrics, and does it depend on genre?
-

Non-consecutive sudoku and roping
I had to find out for myself: Yes, it is possible to have a non-consecutive constraint without roping in sudoku.
-

Population Christmas tree
Why does the population pyramid for Manchester look like a Christmas tree?
-

US County Multi-points
One visual map diagnostic is to plot the coordinates of the points in the polygons and color by the number of occurrences of that point. Two adjacent polygons should share exactly the same coordinates along the shared edges, so interior points should have at least two occurrences.